

Contents

Illuminating the Night: Global Shifts in Artificial Light and the Changing Map of Our Planet
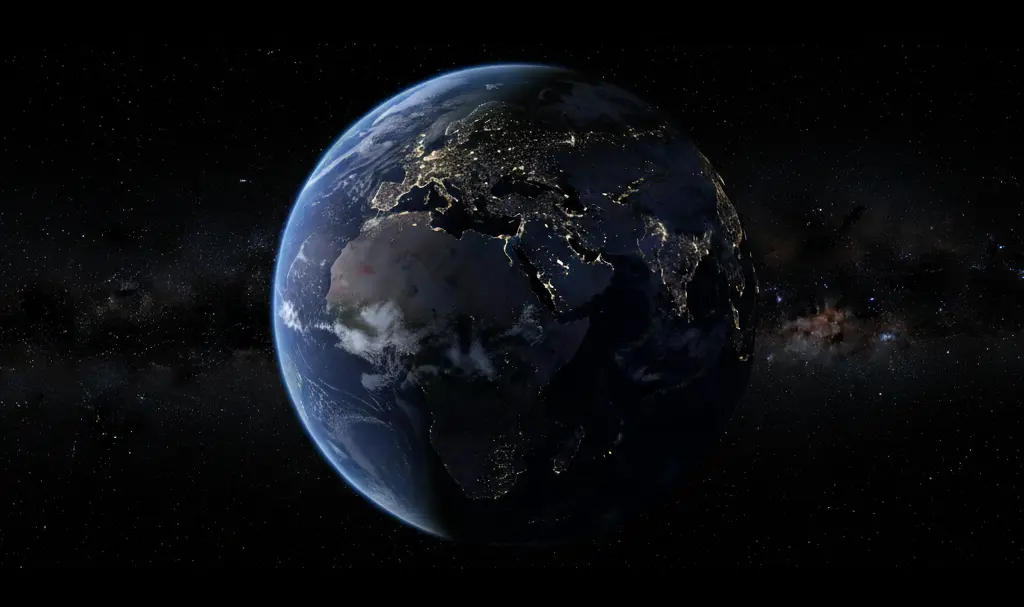
Satellites orbiting our planet reveal a striking reality: the Earth at night is glowing brighter, but this illumination is far from uniform. Recent analysis of global satellite data spanning from 2014 to 2022 indicates a significant surge in artificial light at night (ALAN).

This growing radiance creates a complex mosaic of bright spots and sudden darkness. These shifting patterns reflect rapid urban expansion, the devastating impacts of war, and evolving energy-saving policies that overlap on a single map of the night sky.
The Decade’s Surge in Global Nighttime Brightness
A comprehensive study led by researcher Zhe Zhu, utilizing data from the VIIRS instrument aboard NOAA satellites, reveals a net 16 percent increase in total nighttime light emissions between 2014 and 2022. However, this growth has not been a simple, linear trend.
Scientists emphasize that the global “map of lights” is highly dynamic. While some regions are rapidly illuminating, others are noticeably dimming. This contradicts the traditional assumption that as global GDP and populations grow, the entire Earth simply becomes brighter year over year.
To reach these conclusions, researchers analyzed over a million images captured by US government Earth observation satellites and processed by NASA. Previous global studies typically relied on less frequent annual or monthly composite imagery.
Interestingly, the actual brightness experienced on the ground may be even higher than what satellites capture. Modern blue-rich LED lights are partially “invisible” to certain satellite sensors. Consequently, residents in many cities experience unprecedented brightness, even if orbital imagery suggests only moderate changes.
Where the Lights Shine Brightest—and Where They Dim
The most dramatic increases in nighttime brightness are occurring in developing nations. In these regions, widespread electrification and urbanization naturally accompany rapid economic growth.
- Asia and Africa: India, China, and various countries in Sub-Saharan Africa show profound increases in illumination, serving as practical indicators of improved energy access and nighttime economic activity.
- The Americas: Certain parts of South America are brightening rapidly, while the United States maintained the highest total brightness of any single nation in 2022, followed by China, India, Canada, and Brazil.
Conversely, the situation differs significantly in many parts of Europe. Overall brightness has seen a slight decline across the continent. Nations like France are actively dimming their nighttime landscapes through strict regulations aimed at energy conservation and combating light pollution.
Just as mapping tools must adapt to various accuracy challenges—similar to the complexities encountered in sea-level rise studies and coastal threat maps—mapping nighttime light requires continuous refinement to capture shifting human activities.
The Dark Footprint of Geopolitical Conflicts
The global map also exposes abrupt “holes” in light emission caused by wars and disasters. A stark example is Ukraine, where substantial areas plunged into darkness following the 2022 Russian invasion.
These sudden drops in satellite light data represent severe infrastructure destruction, ongoing power grid failures, and mass civilian migrations. Researchers note that the collapse of Ukraine’s luminous map directly correlated with the intensification of military operations—a pattern similarly observed in other regions suffering from prolonged conflicts.
A Brighter Earth Means a Darker Sky for Astronomy
An unfortunate paradox of our modernized world is that a brighter Earth does not equate to a more visible night sky. In fact, astronomers have warned for years that escalating light pollution is erasing the natural night, severely hindering both amateur and scientific observations.
This pervasive artificial skyglow makes it increasingly difficult for scientists to capture critical astronomical events, such as when astronomers witness planetary collisions deep in the cosmos.
The threat extends beyond spectacular light sources like glowing billboards or architectural illuminations. The ubiquitous transition to LED street lighting emits a high volume of blue light, which scatters easily in the atmosphere and creates a dense, hazy glow over urban centers.
The researchers conclude that the current pace of change is faster and more uneven than previously modeled. Ultimately, Earth’s nighttime light map has become an incredibly sensitive, real-time indicator of human activity on the surface of our planet.
Frequently Asked Questions (FAQ)
Why does the Earth appear brighter even though many cities are adopting energy-efficient LED lights?
While LED lights consume less energy, their cost-effectiveness often leads to a “rebound effect,” where cities end up installing more lighting overall. Additionally, older satellite sensors struggle to detect the blue-wavelength light emitted by modern LEDs, meaning the true level of brightness experienced on the ground is even higher than satellite data indicates.
How do sudden drops in nighttime light emission help global monitoring efforts?
Rapid decreases in artificial light at night (ALAN) serve as immediate indicators of major geopolitical or natural events. Sudden blackouts typically correlate with infrastructure destruction in conflict zones, power grid failures from extreme weather, or mass human displacement.
What are the main consequences of increasing light pollution?
Beyond wasting energy, excessive light pollution disrupts human circadian rhythms and wreaks havoc on nocturnal wildlife ecosystems. It also creates dense “skyglow” over populated areas, severely limiting the ability of astronomers to observe stars, planets, and critical cosmic events.
Source: Nature, TBS News, KoreanHerald, Science Daily. Opening photo: Gemini.